

Technology: cost and profitability modelling
Know where your clients really make money
CostCtrl turns financial and operational data into an activity-based cost model. It shows net profitability by customer, product, channel and activity, which standard financial reports miss, and gives management the facts to manage activities, prices and service levels.
From data to decision
Costs → Activities → Customers and products → Profitability → Decisions
Activity-based costing (ABC) or time-driven ABC (TDABC) on a deterministic engine: every figure traces to the rule that produced it, and scenarios test a decision before you take it.
The problem your clients already have
Financial reports show margins by account, not by customer or product. The cost of serving, supporting and selling stays hidden in overhead.
Without detailed costing, money and people keep going to customers and products that lose money, and nobody sees it for years.
Traditional costing projects take months, cost a fortune and leave the client depending on consultants for every change. Spreadsheet models don't scale and are hard to audit.
How it works
- Costs: load the accounts and the operational data (headcount, hours, transactions, orders, square metres) from monthly exports, with no ERP project needed, and define the cost pools and drivers.
- Activities and allocations: allocate direct and indirect costs to activities, then down to customers, products, channels, regions or assets, with ABC or TDABC drivers.
- Validate: every number traces back to the rule and the inputs that produced it.
- Report: profitability by customer, product, service line and activity, with whale curves and treemaps, exported to Excel, PDF or images.
- Scenarios: copy a scenario, change prices, mix or operations, and compare the outcomes before deciding.
- AI that explains, engine that computes: results explained in plain language, and the client's own AI can run scenarios through a secure connection, while every figure comes from the engine.
What your clients get
Net profitability by customer, product, channel or asset; the few that make the profit and the ones that drag it down; evidence for pricing, cost-to-serve, product mix and investment decisions; a model they own and refresh.
What you get as a partner
A profitability analysis you can offer the clients you already serve, delivered under your brand. It starts with a short pilot on your client's own data, with our people building the model with you and transferring the method.
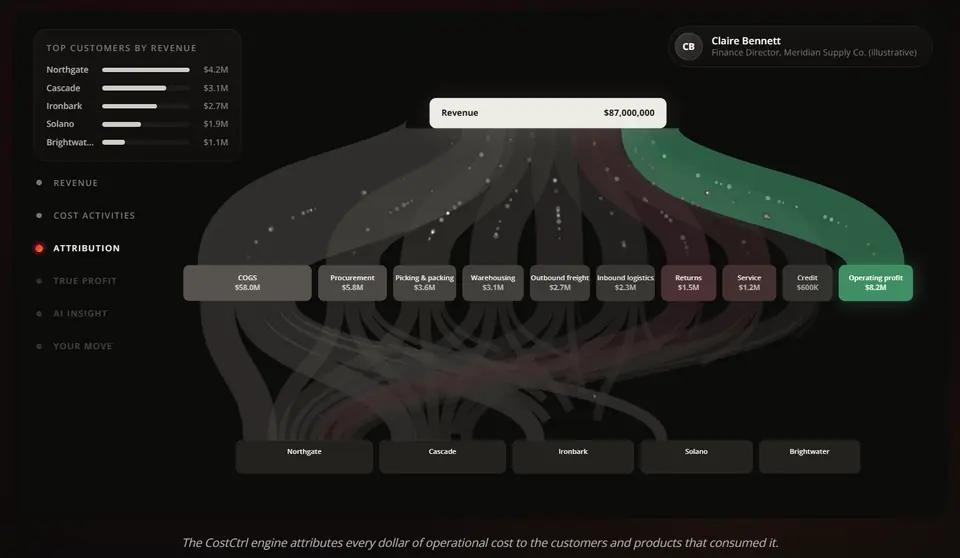
Every cost, traced to the customer that caused it (illustrative view). In CostCtrl this view is live, not a static snapshot: it updates with the data, and AI can analyse it on the fly so management can decide quickly.
Where it fits
Questions our people know how to answer
Customer and product profitability · cost to serve · pricing and product mix · cost of processes and activities · shared-services costs and internal charging · asset and maintenance costs · budgets and what-if scenarios.
Three ways we use it
- Profitability engagement: first results in three to six weeks, on your client's own data, to answer "where do we really make money?"
- Workload and cost: activity costs come from measured effort, using our workload and capacity method.
- Shared services: cost per service and fair internal prices for SSC and GBS.
In the cloud on AWS in the European Union, with each company's data separated, encrypted, and never used to train AI.
CostCtrl in the real world
What a cost model reveals
Case and figures published by CostCtrl.
Distribution: New Zealand
Snell, industrial packaging and safety
Of 1,951 customers, 830 were losing money once the real cost to serve was counted. With repricing, consolidated orders and a focus on profitable lines, Snell recovered USD 670,000 of negative contribution and cut loss-making customers by 64%.
The typical pattern
The whale curve
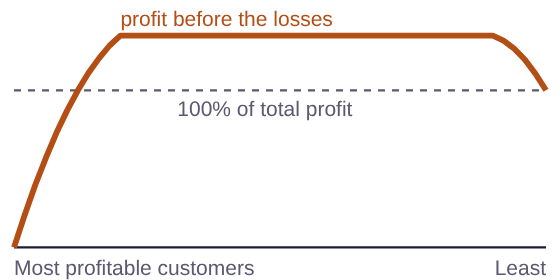
In a typical customer or product analysis, 20% generate 80% of the profit, 70% barely break even and 10% lose money, pulling the total far below its potential. Ranked from most to least profitable, cumulative profit climbs above 100% and then falls back: that shape is the whale curve.
Products and customers
The 80/20 rule, in numbers
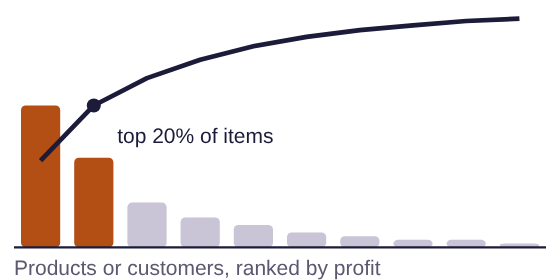
The Pareto principle, the 80/20 rule, shows up in almost every profitability model. One typical example: 70% of the profit came from 20% of the products, and 50% from 10% of the customers. The bottom 60% of customers produced only 10%.
Pairs well with
Measure the work, cost it, fix it
Measure the work first
Time and effort are the drivers a good cost model needs. Our workload method and process mining give them. See Mindzie
Fix what the model shows
Where cost to serve is high because of manual work, automation brings it down. The finance back office, end to end
Do your clients know which customers and products make them money?
Let's talk. A 45-minute conversation to see whether a profitability pilot fits the clients who already trust you.

